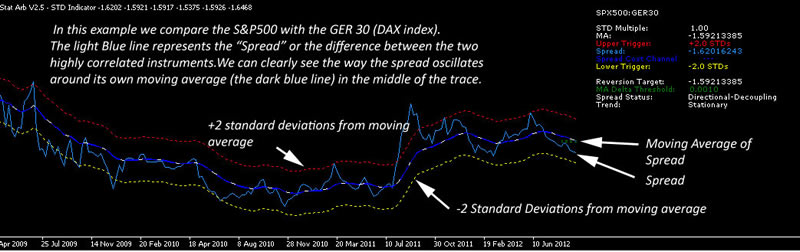
This trading strategy demands a good understanding of leverage and risk control, the ability to analyse highly correlated instruments across different asset classes and an understanding of how to interpret spreads. (The Spread is the effective difference between the two instruments being monitored for potential arbitrage opportunities.
The image below introduces "The Spread" which is a core component of any arbitrage system.
Video Walkthrough for Spread Basics
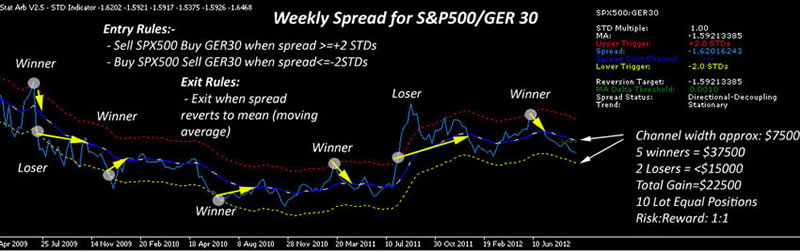
The screenshots above demonstrate the potential for healthy profits using statistical arbitrage / conversion trading techniques. The keen eyed will note the timeframe over which these conceptual trades were made was from April 2009 through to September 2012 - 7 trades in over 3 years definitely qualifies for low frequency trading although the potential upside opportunities from long term arbitrage trades can be exceptional. However, most traders require higher trade frequencies so an arbitrage system needs to be able to operate on much lower timeframes and with much higher trading frequencies.Arbitrage Trading Timeframes and Perspective
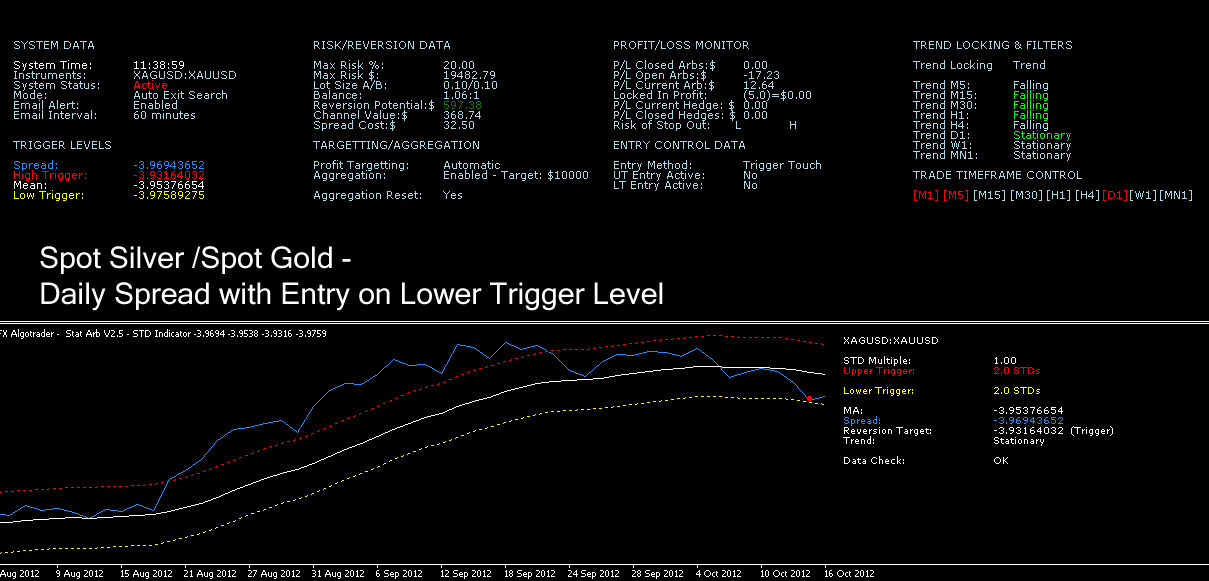
The S&P500/GER40 example above elegantly showed the simplicity of the mean reversion technique. However, when highly correlated assets are analysed on shorter timeframes the situation becomes more complex. Theoretically the ideal time to execute arb trades using conventional entry and exit logic is when the spread is termed 'stationary'. This is where the spread (the difference between the prices of the two instruments) oscillates fairly sinusoidally around it's moving average. Ideally the moving average should be as flat as possible.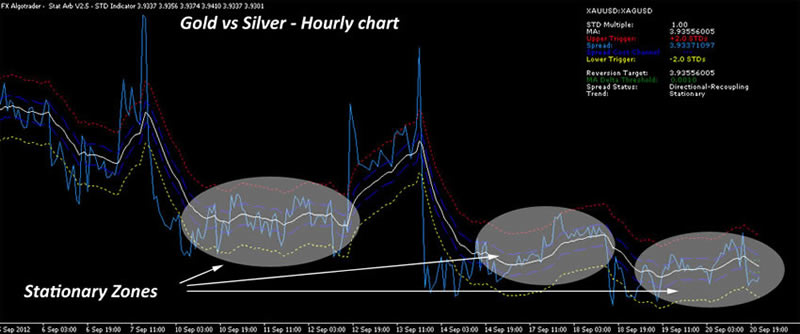
The screenshot above for Gold and Silver demonstrates how the spread changes from a directional to a stationary nature over quite a short time period. A stationary spread is ideal for arb trading as it permits trades in both directions - ie selling Gold/Buying Silver when the spread is above the upper trigger level and buying Gold/selling Silver when the spread is below the lower trigger level. The challenge occurs when the spread dynamics change from 'stationary' to 'directional'. A directional spread is where the moving average is increasing/decreasing over time. In other words one pair is continuously strengthening while the other is either unchanged or weakening. In this scenario we need an automated arbitrage engine to be able to automatically detect the direction of the spread. Over the course of the V3 development program we have experimented with various algorithms to track and monitor spread trend. In the latest version we are using a multi-timeframe detection algorithm to determine whether the spread is stationary (ranging) or directional (trending). These are detailed in detail in the modular overviews which follow.
V3 Architecture
The first V3 versions were released in Jun 2011 and the product has been updated and improved systematically since launch. V3 provides a new graphical user interface and a whole host of other features detailed below.The V3 Arbitrage System consists of two core components:-
| The Gen Starb expert advisor (EA) |
| The STD Indicator |
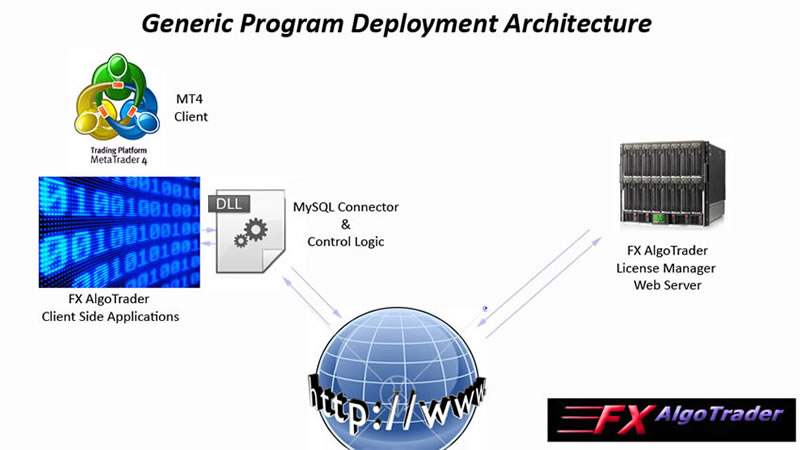
In simple terms the STD indicator monitors the spread and provides entry signals. The expert advisor carries out trade execution and management functions. Essentially the two applications communicate in real time using the MetaTrader Global Variable (GVAR) table. They both sit on a generic FX AlgoTrader deployment archtecture shown in the image below.
RISK DISCLOSURE
The products on this site are trading tools and are not intended to replace individual research or licensed investment advice. Past performance does not guarantee future results. Trading currencies involves substantial risk, and there is always the potential for loss. No representation is being made that these products will guarantee profits or not result in losses from trading. Any explanation or demonstration of the product's operation should not be construed as a trade recommendation or the provision of investment advice. The purchase or sale of a currency can only be performed by a licensed Broker/Dealer.
The V3 STD Indicator
The STD indicator produces real time spread statistics which are made available to the Generic Arbitrage engine via the MetaTrader Global Variable Table. The STD Indicator is made up of several components which are detailed in the diagram below.
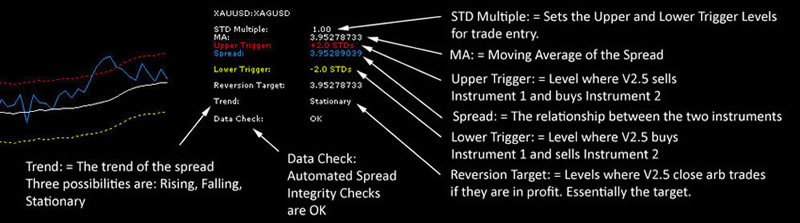
STD Multiple - This parameter allows traders to tune the trigger levels for the arb entry points. The STD Multiple is adjusted by accessing the external input parameters for the STD indicator. Ideally traders should look to set the STD Multiple so that peaks in spread divergence coincide with the upper and lower trigger levels. In the screenshot below we can see the STD Multiple has been adjusted down to 0.7 on the Daily chart to coincide with typical peaks in spread divergence.
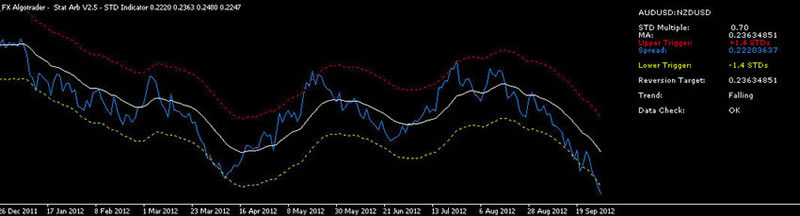
Data Outputs - The STD indicator calculates the moving average (MA), the spread and the upper and lower trigger levels (based on the STD multiple) in real time.
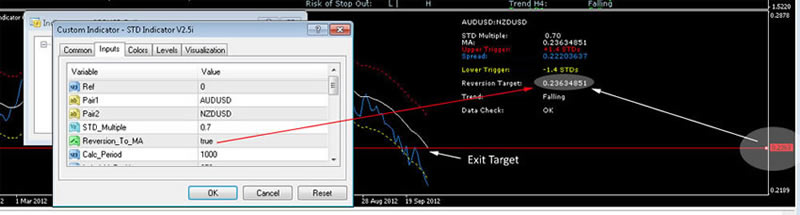
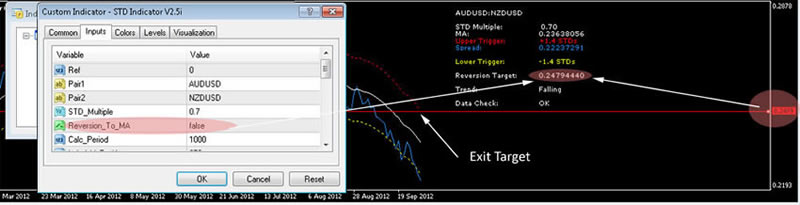
Reversion Target - The reversion target shows the level were the system will attempt to close the arb. By default the mean is always used as the arb exit target but traders can manually change to target to the opposite trigger band by changing the 'Reversion_To_MA' external input parameter to 'FALSE' in the STD indicator options.
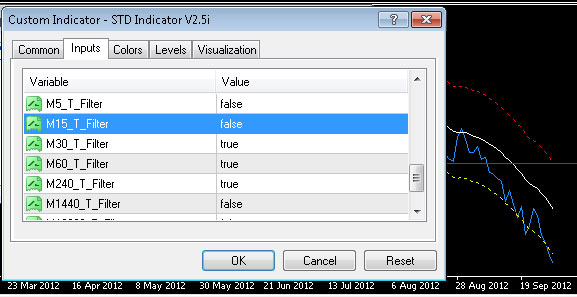
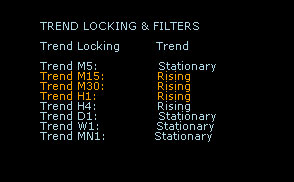
Trend - The trend indicator is based on a proprietory multi-timeframe stacked EMA algorithm. Traders can adjust up to 8 trend filters which calculate the trend based on multi-timeframe trend analysis. For example, a trader may prefers to trigger their arb trades from the 15 minute chart and may want to lock the trades in the direction of the M30, M60 and M240 trends. In this case the trader would simply set the M30, M60 and M240 T_Filters to 'True' as shown in the screenshot below.
Data Check: This is a new feature which performs 4 data integrity tests on the spread when its loaded onto a chart initially. If the spread passes the integrity checks the "OK" data label will be shown. The arbitrage engine cannot place trades unless the Data Check flag reads "OK"
The V3 Expert Advisor
The generic arbitrage engines constantly monitor the MetaTrader global variable table for trade entry and exit data for the various arbs which the trader has set up on each chart. It is important to mention that each chart must have a seperate instance of both the STD indicator and the arbitrage engine running together. The screenshot below shows a complete Stat Arb V3 set up on a MetaTrader chart.
Screenshot of the V3 EA and STD indicator on a MetaTrader chart. Note: No data is populated as it's a weekend.
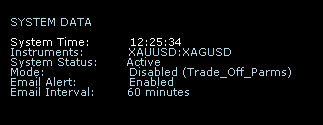
The System Data Module
The System Data module displays the current system time, which instruments are being traded, the system status, the system mode and the email alert status. For details explanations please refer to the Technical Data Sheet.
 |
Play Video Overview |
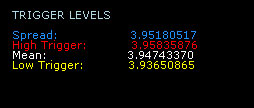
Trigger Level Module
The Trigger Levels section displays the current Spread, the moving average or mean of the spread and the Upper and Lower trigger levels where trade entries will be executed.
 |
Play Video Overview |
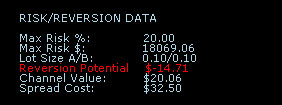
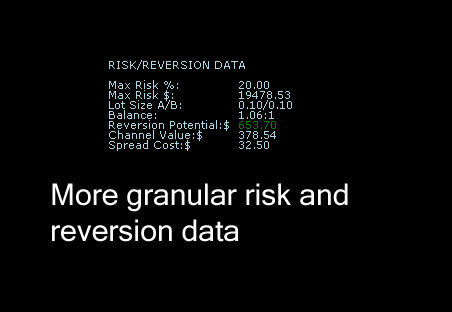
Risk/Reversion Data Module
The Risk & Reversion data module shows the maximum permitted risk for the arb as both a percentage of account equity and also as a dollar figure. The display also details the position size for each leg of the arb, the reversion potential, the channel value and the cost of executing the arb trade. For details explanations of these terms please refer to the Technical Data sheet. Note: the latest release also displays the tick value for each instrument which assists the trader in balancing the arb to make it as market neutral as possible.
 |
Play Video Overview |
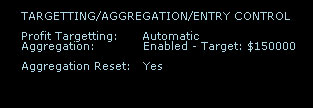
Targetting, Trade Aggregation and Entry Control Module
The Targetting, Aggregation and Entry Control module displays the system settings for the profit aggregation system including the daily aggregation target. Please refer to the Technical Data Sheet for additional information.
 |
Play Video Overview |
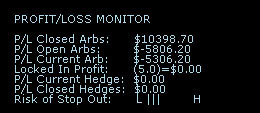
Profit & Loss Module
The Profit & Loss Module displays the profit and loss for closed arbs, open arbs, the current arb (if open), the locked in profit (if appropriate), the current hegde and finally the P&L of the closed hedges.
 |
Play Video Overview |
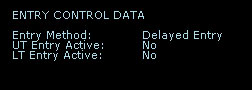
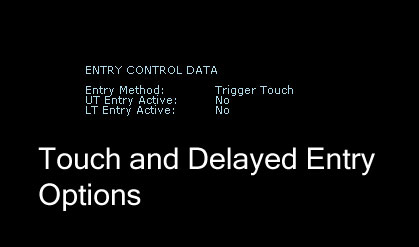
Entry Control Module
The entry control module allows the trader to determine whether trades are executed when a trigger is 'touched' or when the spread had definitively broken through a trigger level and then returned to the trigger point - hopefully in a convergent fashion. ie returning to it's mean. The LT Entry Active and UT Entry Active data labels are used when a delayed entry method is chosen. If the spread in the last chart period closed above or below the upper or lower trigger levels respectively - AND - the spread was still above or below the respective trigger levels the system would set the 'LT Entry Active' (Lower Trigger) or 'UT Entry Active' (Upper Trigger) flags to TRUE. Once these flags are set the arbitrage engine will place trades the next time the spread touches the respective trigger level.
 |
Play Video Overview |
Trend Filtering Module
The trend filtering module displays the trend of the spread on the M5 to Monthly timeframes. The Trend locking parameter is also displayed at the top of the module and informs the trader whether the system is trading in the direction of the trend or locked long or short. This would be up to the trader's discretion.
 |
Play Video Overview |
RISK DISCLOSURE
The products on this site are trading tools and are not intended to replace individual research or licensed investment advice. Past performance does not guarantee future results. Trading currencies involves substantial risk, and there is always the potential for loss. No representation is being made that these products will guarantee profits or not result in losses from trading. Any explanation or demonstration of the product's operation should not be construed as a trade recommendation or the provision of investment advice. The purchase or sale of a currency can only be performed by a licensed Broker/Dealer.
Automatic and manual profit targeting options
On chart trade analytics
Email alert facility (when run in non automatic mode)
Granular trade timing controls
Configurable risk control
Automated Trend Detection and locking functionality
Profit aggregation system
Auto Hedging Feature
Global lot sizing and aggregation targets
Voice synthesis alert system
Profit Locking Feature
Variable Leg A/Leg B Position sizing
Multi-instrument support - Trade indices, commodities, forex, CFDs.
More accurate reversion, channel and spread algorithms
More accurate entry display logic
Delayed Entry Control
Multi-time spread trend detection algorithm
Integrated spread data checking facility
Revised Graphical Interface
Simplified Trade Control Systems
RISK DISCLOSURE
The products on this site are trading tools and are not intended to replace individual research or licensed investment advice. Past performance does not guarantee future results. Trading currencies involves substantial risk, and there is always the potential for loss. No representation is being made that these products will guarantee profits or not result in losses from trading. Any explanation or demonstration of the product's operation should not be construed as a trade recommendation or the provision of investment advice. The purchase or sale of a currency can only be performed by a licensed Broker/Dealer.
.jpg)
V3 Expert Advisor Interface
.jpg)
Interface for V3 STD Indicator
Entry Option Module
Reversion Data Module
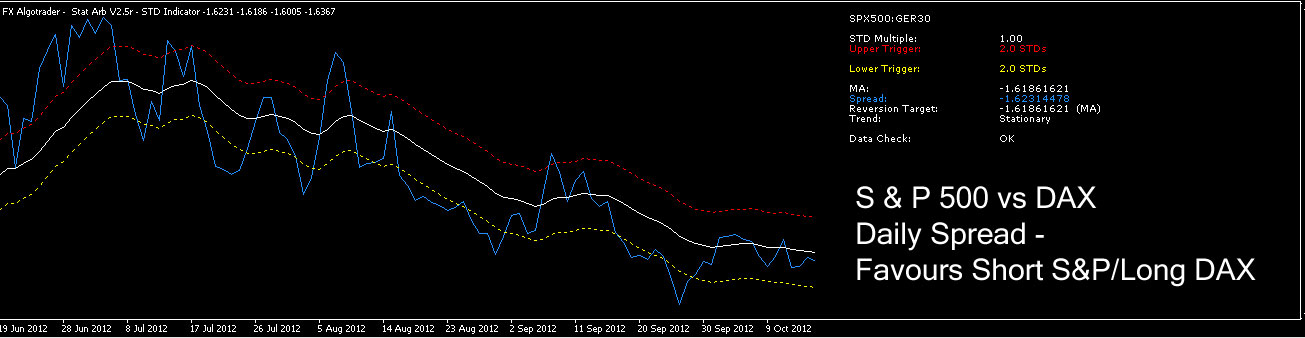
DAX/S&P 500 Example
Spot Silver/Gold Daily Example
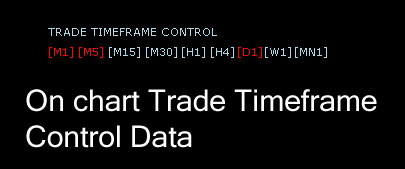
Timeframe Control Data
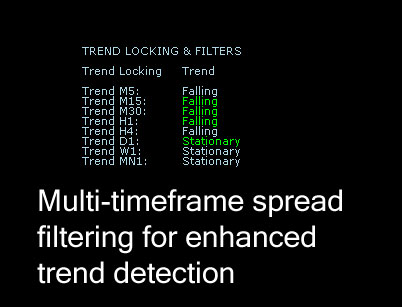
Trend Filters and Locking
Stat Arb V3 allows fully Automated unattended Arbitrage Trading from pre-configured charts
Using Arbitrage techniques increases the likelihood of profitable trades (timeframe dependent)
Stat Arb V3 provides a highly granular data set which allows traders to see the potential reversion profits from specific arb set ups prior to entering the market.
Stat Arb V3 is a proven, robust trading toolset which has been iteratively developed since 2009.
Supporting Products:
FX AlgoTrader Real Time Correlation Indicator
RISK DISCLOSURE
The products on this site are trading tools and are not intended to replace individual research or licensed investment advice. Past performance does not guarantee future results. Trading currencies involves substantial risk, and there is always the potential for loss. No representation is being made that these products will guarantee profits or not result in losses from trading. Any explanation or demonstration of the product's operation should not be construed as a trade recommendation or the provision of investment advice. The purchase or sale of a currency can only be performed by a licensed Broker/Dealer.
Request Product Data Sheet
FX AlgoTrader DO NOT pass on email addresses to third parties
 |
$99.95 USD
One Time Fee with free Technical Support (no ongoing charges) |

Testimonial #1
Testimonial #2
Attachment contents - 'New Arb Trader' refers to FX AlgoTrader arb tools as 'FxAlgo'.
Introduction
FxAlgo was selected after an exhaustive search of the Internet for automated arbitrage software products that worked within the MetaTrader 4 trading environment.
FxAlgo was then tested on four demo broker accounts for a period of two weeks trading FX products only.
FxAlgo provided both a stable automated trading platform and a more than acceptable ROCE whilst under test.
FxAlgo was then implemented on a live trading account and it has provided returns of over 48% on our initial equity injection over only a six day trading period.
Support
The support provided by the author and owner of FxAlgo; both during the test period and since moving into live operation has been excellent; the level of support we have experienced cannot be faulted.
All requests for assistance by email have been answered almost by return and the owner has shown a keen interest in ensuring we were fully appraised of the best methods of applying FxAlgo to meet our trading objectives.
The currency pairs we have traded were selected using FxAlgo’s Correlation Indicator which has been proven to be an extremely useful addition to the FxAlgo V2.5 trading engine.
FxAlgo is being used by us to trade currency pairs on the H1 and D1 timeframes. The H1 timeframe was employed initially to gain a faster appreciation of FxAlgo’s operation and how to control its trading.
Since gaining a basic appreciation of the FxAlgo V2.5 trading engine the D1 timeframe has been added and profits have increased as arbitrages in the D1 timeframe seem to offer generally higher profit margins, albeit that they take longer to close out.
Trading parameters
The standard trigger settings shipped with FxAlgo were initially employed to trigger arbitrage trades. These have been found perfectly adequate and have produced a more than acceptable ROCE.
The EB variables recommended in the documentation shipped with FxAlgo work well and have proven to be extremely useful whilst getting to know FxAlgo. They control fundamental trading risk and are a useful extension to the V2.5 engine.
We have employed FxAlgo in its stationery recoupling mode only.
Global Variables
We currently trade FxAlgo across a substantial number of currency pairs and across two different time frames and have found FxAlgo’s Global Variables to be of invaluable assistance.
These Global Variable allow us to manage risk and capital drawdown across our entire trading activity with consistency and ease.
Trade Risk
We manage individual trade risk by manipulating the extensive parameters provided on each currency pairs individual trading sheet.
Errant Spreads
We have not experienced any errant spreads or any resulting errant trades as yet.
Win/Loss Ratio
The win/loss ratio we have achieved to date is 65/35%.
Asset Classes
We have only employed FxAlgo in our FX trading to date.
However, we have plans to extend our use of FxAlgo to Commodities and Indices trading after we have performed further tests against these two asset classes.
Conclusion
We have found FxAlgo V2.5 and the Correlation Indictor to be not only excellent and robustly written software but also from a business perspective to have more than met our stated goals to date.
We have also recently acquired the FxAlgo Zeus Risk Controller product but have not yet had time to test this product.
The ROCE achieved in live trading (only 6 days to date) has already met the majority of the acquisition costs of both FxAlgo V2.5 and the Correlation Indicator and fully we expect the breakeven point to occur within the first 10 days of trading.
New Arb Trader's Equity Curve - Live Account
RISK DISCLOSURE
The products on this site are trading tools and are not intended to replace individual research or licensed investment advice. Past performance does not guarantee future results. Trading currencies involves substantial risk, and there is always the potential for loss. No representation is being made that these products will guarantee profits or not result in losses from trading. Any explanation or demonstration of the product's operation should not be construed as a trade recommendation or the provision of investment advice. The purchase or sale of a currency can only be performed by a licensed Broker/Dealer.
There are a lot of people looking for fire and forget trading systems which they can drop on a chart, sit back and watch their $50 initial equity grow into $10 Million in the first year. Yes.... people really do believe tools like this exist and unfortunately there's no shortage of vendors happy to position their 'products' as fulfilling these fantasies! FX AlgoTrader are not one of these vendors.
The Stat Arb EA tools on this site are 'tools' NOT ROBOTS. They provide a rich arbitrage toolset which allows traders to automate their arb trading strategy on whatever timeframe they prefer. If you've never made a penny trading FX or other assets the chances of making money using arb tools, unfortunately, isn't high. They won't turn a losing trader into a winning trader but they will automate an arb strategy and provide solid risk control. How much you make will depend on how good you are as a trader.
Some people can run faster than others - if you've got good equipment it makes the job easier!
So to create a balanced EURUSD/EURJPY arb you would need to use 1 lot for the EURUSD leg and 0.78 lots for the EURJPY leg.
If we reduce the position size to 0.1 lots ($10,000- a mini lot) the position sizes would need to be adjusted to 0.1 and 0.078. So unless you had a micro account you would have to run two mini lots for both legs.
Once you reduce the position size to micro lots the effect of balancing the arb becomes increasingly less significant.
*The easiest way to calculate the pip value is to use an online pip calculator
For advanced arb traders it is possible to create the same arb on a different timeframe by reversing the pair sequencing thus creating an 'inverse' arb. Eg EURUSD/GBPUSD on H1 and GBPUSD/EURUSD on M15. However, the trader would have to control the trade direction of both arb setups by using the trend locking options. This approach can be used to hedge and also reduce drawdown on longer term arbs but this strategy is complex due to the skill required in closing the inverse arb component when long term mean revsersion takes place.
The trade entry thresholds (STDs) are set by eyeballing the typical departure from the mean before the spread recouples. Obviously timeframe and system parameters are critically important. 5 minute charts can show what looks like a stationary spread but this can change very quickly and become highly directional. On the other hand a weekly chart provides much more insight into the medium/long term spread dynamics. Short term arbing is very difficult and it's easy to get caught when the pairs decouple. This is often seen towards the end of the Asian session and near the Frankfurt open. As liquidity flows into the market spread can become directional over short timeframes.
In terms of suitable arb pair selection you can use the FX AlgoTrader real time correlation indicator to select highly correlated arbitrage pairs on any timeframe.
The V3 system uses a log spread algorithm which allows the trader to see the reversion potential in dollar terms. This allows traders to see the power of the longer term arb compared to short term arb trading.
A customer made 1200 USD off a 5000 USD account in a week. The guy is an x-commercial trader so bear that in mind! The tool is only as good as the trader in terms of picking the right pairs to trade and setting the right parameters.
So, in summary, arb traders will need to experiment to find the best system settings which match their trading style, risk and general expectations.
In terms of timeframe you can make a lot more money on longer term charts in comparison to short term high frequency arb trades. We dont produce ROI or equity curve data any more as the results will vary hugely from trader to trader. The tools only reflect the ability of the trader to select the optimum assets, timeframes and parameters to trade. It all goes back to how fast can you run :)
- The arb trades have breached the maximum risk parameters and the system has auto closed both positions
- The system is being run in Aggregation mode and the daily profit target has already been achieved - once the profit target is hit the system will close out all open arbs - this could result in loss making arbs being closed automatically to protect your achieved aggregated target.
- The trader has set the arb entry points too close to the spread cost channel and the potential profit is so small slippage is tipping the P/L of the arb negative during the arb close procedure. This can easily be solved by trading on longer timeframes and/or increasing the STD multiple to move the trade entry further away from the spread cost channel.
1) V3 can only close arb trades which are in profit. If your current arb is not in profit (possibly as it was opened on another timeframe) the system will not close the arb trades.
2) The 'Trade_Off_Timeframe' parameters are not enabled for this chart timeframe
3) The arb trade has been hedged
1) 'Close_All_Trades' parameter is set to true.
2) The aggregated daily profit target has been achieved and auto reset is disabled
3) The account equity is below the minimum limit
To resolve this problem go to the Global Variable Table in MT4 - press F3 - look for a global variable called "Disable Gen Starb" with a value of '1'. If you delete the variable the system will reactivate.
Additional Comment: Some V3 customers have been experimenting with a alternative approach to dynamic rebalancing in cases where an open arb trade is decoupling from it's MA and creating a drawdown.Rather than rebalancing the lot sizing of the existing arb a new arb is set up which is the exact opposite of the current arb. For example if you had a 5 lot per leg EURUSD/GBPUSD arb which was triggered off an houly chart you would set up a GBPUSD/EURUSD arb running on a 15 minute chart and use the 'Lock_Long' or 'Lock_Short' parameters to force any new trades off the 15 minute chart to the exact opposite of the arb on the longer timeframe. This creates a perfect hedge and also allows reduces the drawdown as the shorter term arb will gradually eat into the drawdown created by the longer term decoupled arb. The principle is simply based on trading short term spread volatility seen on the shorter timeframe. This approach is not a guaranteed "Get of jail free card" but it can substantially de-risk positions where significant decoupling has taken place and in tandem reduce the magnitude of a potential loss.
So if you’re criteria is daily correlation >75 and 5 min correlation <-75 you could set up the arb product on your 5 minute chart (probably easier to use an hourly actually) and then set you’re STD multiple in the STD indicator so that your trade entry triggers were where you want them. You could do this visually and look to only trade the largest divergences each day.